ETF X-Ray: What's Actually Inside a Fund
An ETF’s name is marketing; its holdings are the product. Two funds with near-identical names can differ completely in sector tilt, country exposure and concentration — and the difference only shows up when the composition is laid out: which sectors, which countries, which ten companies actually dominate the basket.
Below, a full x-ray of one of Europe’s most widely held funds — the iShares Core MSCI World ETF — from sector donut to holdings flow, plus a “fee twin”: a fund with nearly the same exposure at a very different yearly cost.
X-ray any ETF before choosing it
Two ETFs with near-identical names can hold very different things. The ETF page on Slowio opens one up before it is chosen: what it actually holds, how it spreads across sectors and regions, what it costs each year. Here is that x-ray for one of the largest world ETFs Slowio follows:
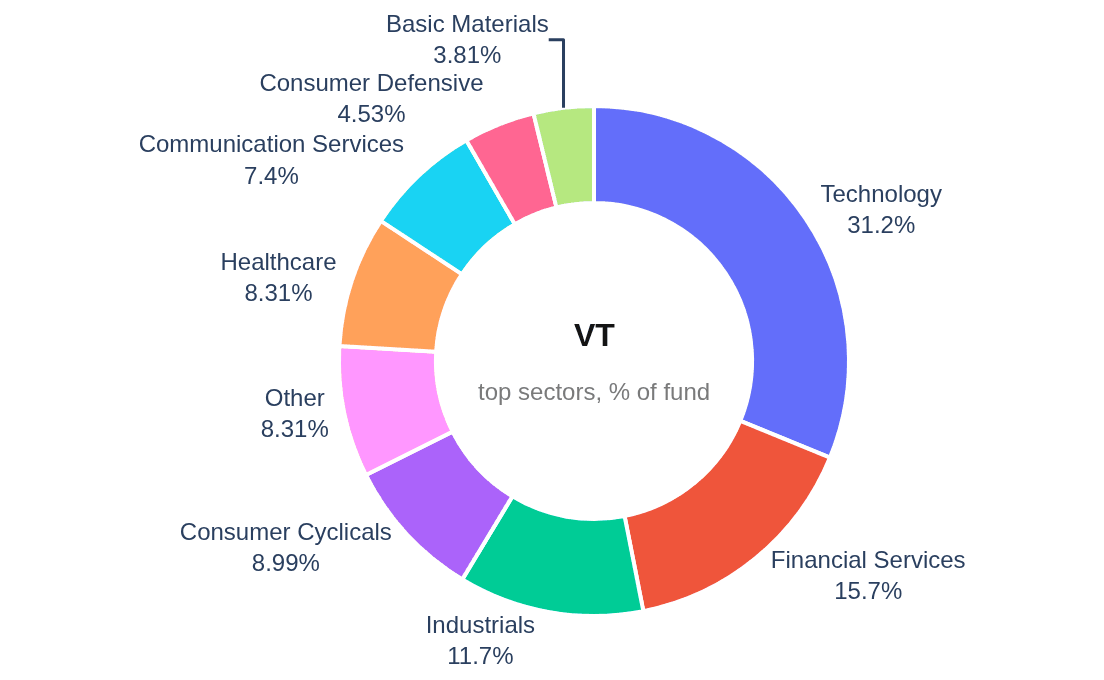
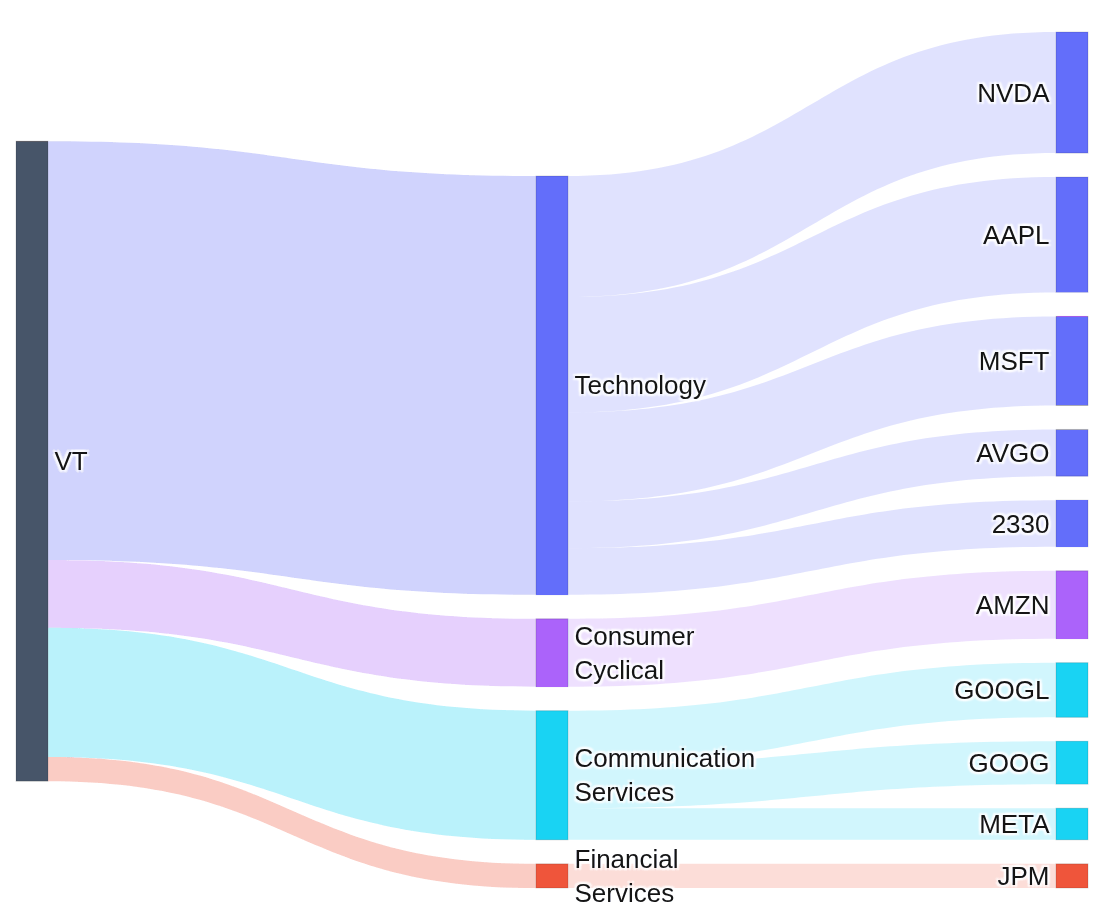
Behind the charts, the page condenses the fund facts that take longest to dig out of a factsheet:
0.07% TER (yearly cost) | $82.0B Fund size | 20.8% Return 3y ann. |
21.2% Top-10 weight | 64.6% North America | 31.2% Technology |
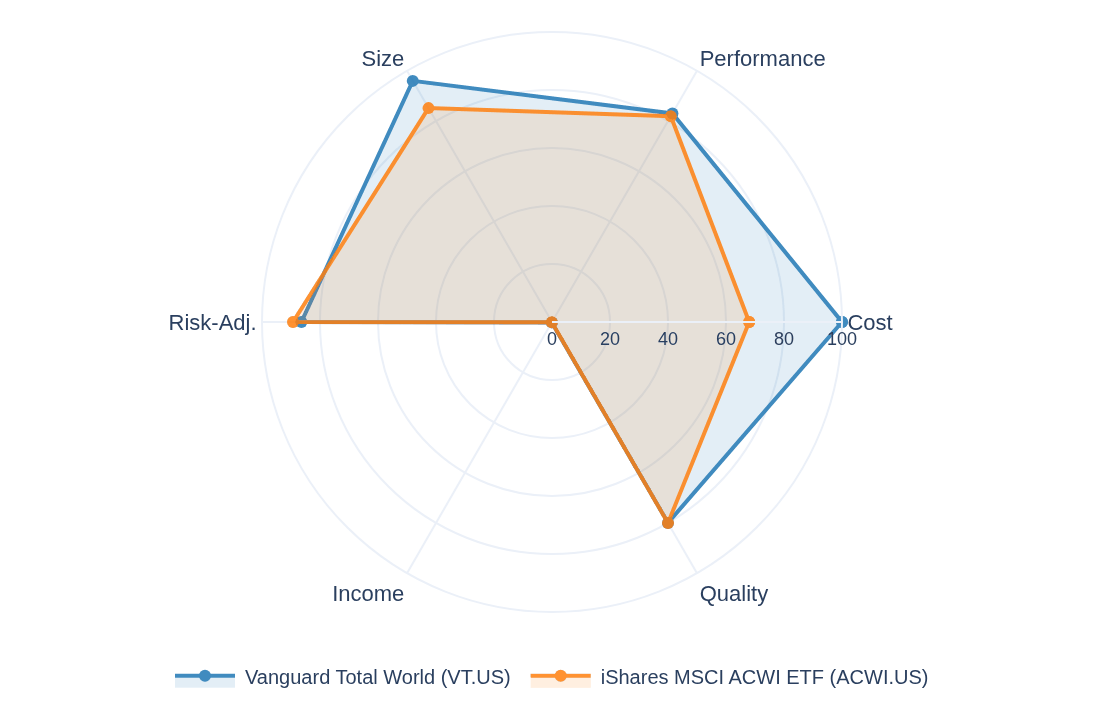
One number in that band deserves a second opinion: the fee. iShares MSCI ACWI ETF (ACWI.US) sits in the same Morningstar category with near-identical regional weights, 67% North America to 65% — yet its yearly cost is 0.32% to 0.07%: 4.6× apart for near-identical exposure. And on the ETF-Compare radar the two are twins on every axis except Cost and Size:
And one step further — the Correlations tab puts Vanguard Total World Stock Index Fund next to the four big asset classes: US equities (SPY.US), long-term Treasuries (TLT.US), inflation-linked Treasuries (TIP.US) and gold (GLD.US). Over 180-day returns since 2009, the tightest link is VT.US–SPY.US at +0.96; against gold it drops to +0.21.
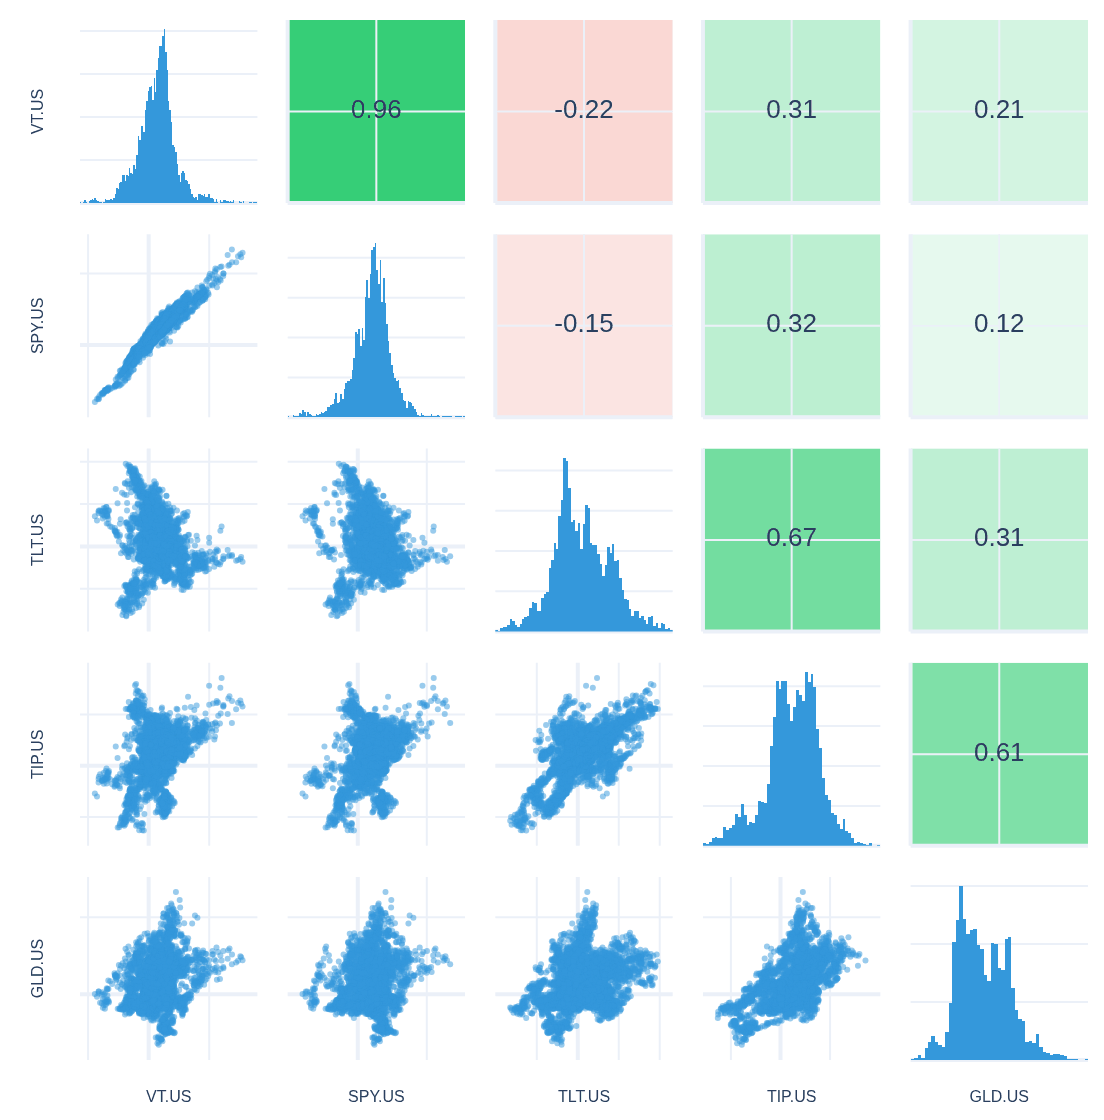
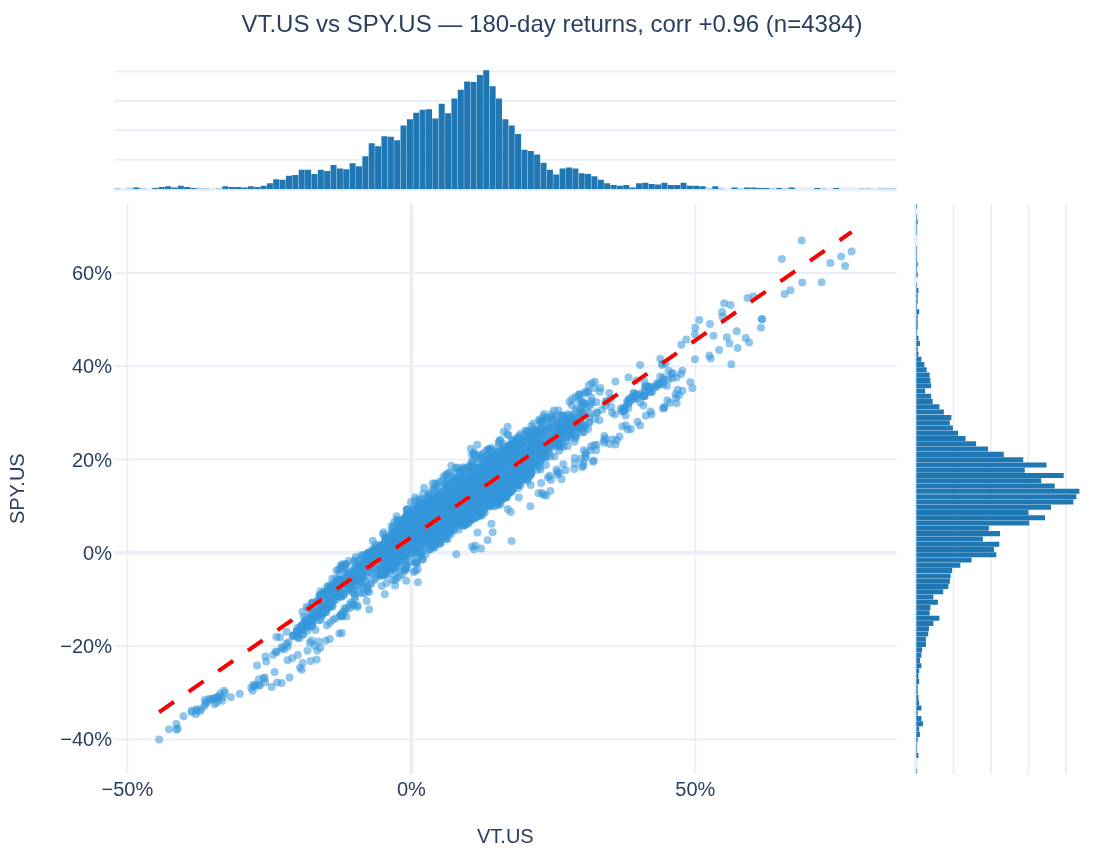
The tightest link above — +0.96 against US equities — is the x-ray in one number: with North America at 65% of assets, a world fund largely moves as a US fund.
The same page adds performance and risk tabs, cost analysis, and a “find similar ETFs” search — one URL per fund, for any ETF Slowio follows.
Slowio is an educational research tool, not financial advice. Figures are computed from Slowio’s data snapshot at build time and may not reflect the latest market data — nothing in this email is a recommendation to buy or sell any security. Do your own research.
Run the same analysis on any of the 9,000+ companies Slowio follows — free, no card required.